The Fed remains on course….. The US job report was very close to consensus, with the non-farm payrolls increasing 217k in May, almost exactly on the 215k forecast.
The Big Picture 09.06.2014, 10am April’s strong number saw a modest downward revision to from 288k to 282k. Still a strong figure, although I believe it was boosted a little by the unwinding of the earlier weather distortion. The unemployment rate remained unchanged at 6.3% contrary to expectations of a small rise to 6.4%. It mirrored a rise in household employment of 145k and an increase in the labor force by 192k. Average weekly hours worked also remained unchanged at 34.5 and average hourly earnings increased by 0.2% mom pushing the yoy rate up to 2.1%. Overall, the employment report points to a fairly robust job growth supporting private consumption, but at the same time, it points to still moderate inflationary pressures from wages. It was mostly in line with market estimates and this increases the likelihood that the Fed will stick to its course of removing monetary accommodation from a strengthening economy. The reaction in the market was modest, with the 10-year US Treasury yield remaining just below 2.6%. EUR/USD rose approximately 50 pips after the report was published, probably due to the lack of a positive surprise, but gave back the gains and depreciated even more as investors evaluated the report as encouraging, which I agree it was. The loonie depreciated after Canada’s unemployment rate unexpectedly rose to 7.0% in May from 6.9% in April. The forecast was for the rate to see no change. The number of employed people rose by 25.8k after declining 28.9k in April, but the gains were due to a surge in part-time jobs. On the other hand, full-time employment declined, bolstering the BoC’s wary outlook on the economy. Asian stocks gained as on Sunday, a report showed that China’s trade surplus rose more than estimated in May, driven by a surge in the nation’s exports, while on Monday, Asian time, Japan’s final GDP for Q1 was revised up to +1.6% qoq from the initial estimate of +1.5% qoq, the fastest pace since 2011. At the time of writing, the Nikkei is 0.40% up and the Shanghai Composite is trading +0.45% higher. Nikkei’s advance pushed USD/JPY higher, in other words, it caused the yen to decline. Today, during the European day, the only indicator we have is Canada’s housing starts for May, which are forecast to have declined to 185.0k from 195.3k in April. We also have three speakers on schedule: St. Luis Fed President James Bullard, Boston Fed President Eric Rosengren and Federal Reserve Governor Daniel Tarullo. As for the rest of the week, on Tuesday, we get China’s PPI and CPI data for May, while from Australia, home loans are coming out. In Switzerland we have the unemployment rate for May, while from the UK, industrial production is coming out. We also get US wholesale inventories for April. On Wednesday, we have Australia’s Westpac consumer confidence index for June and the UK unemployment rate for April. On Thursday, the Reserve Bank of New Zealand is forecast to raise its official cash rate by another 25bps to 3.25%. RBNZ Governor Wheeler will hold a news conference after the rate decision. As for indicators, we get the Australia’s unemployment rate for May, Eurozone’s industrial production for April and US retail sales for May. Finally on Friday, during the Asian morning the Bank of Japan ends its two-day meeting, with once again no change of policy expected. During the European day, we get Sweden’s unemployment rate for May and the University of Michigan preliminary US consumer sentiment for May.
THE MARKET
EUR/USD below the 38.2% retracement level
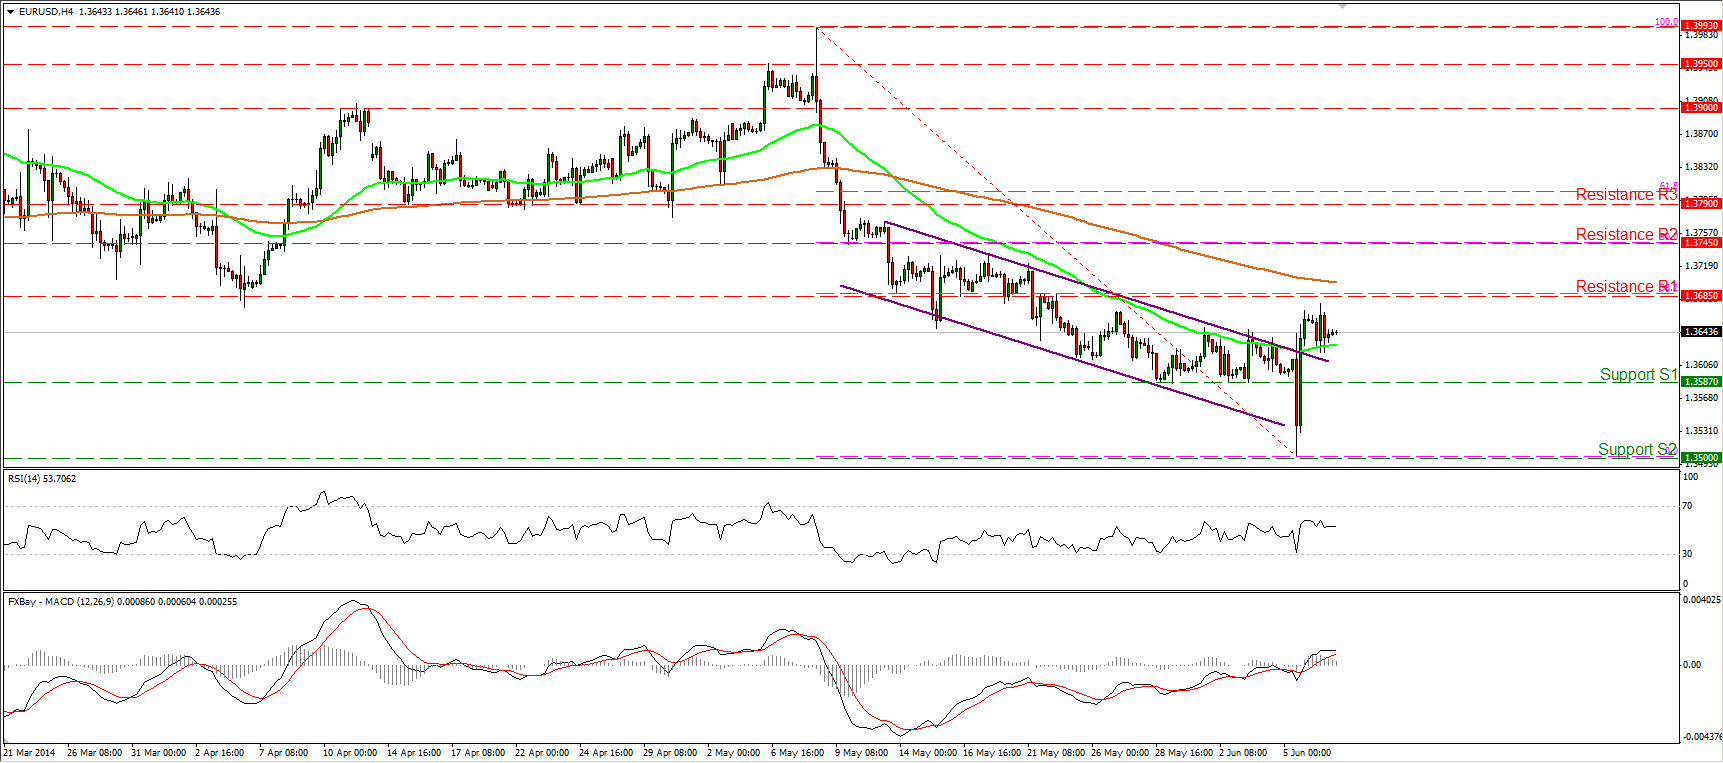
EUR/USD moved slightly lower but managed to maintain its rate above the upper boundary of the prevailing purple downtrend channel. The pair remains below 1.3685 (R1), the 38.2% retracement level of the 8th May-5th June decline, where a break could trigger extensions towards the next hurdle at 1.3745 (R2), which coincides with the 50% retracement level of the aforementioned decline. In the bigger picture, the daily MACD, although in its bearish territory, crossed above its trigger line, increasing the possibilities for the continuation of the retracement.
Support: 1.3587(S1), 1.3500 (S2), 1.3475 (S3)
Resistance: 1.3685 (R1), 1.3745 (R2), 1.3790 (R3)
USD/JPY rebounds from the lower bound of the channel
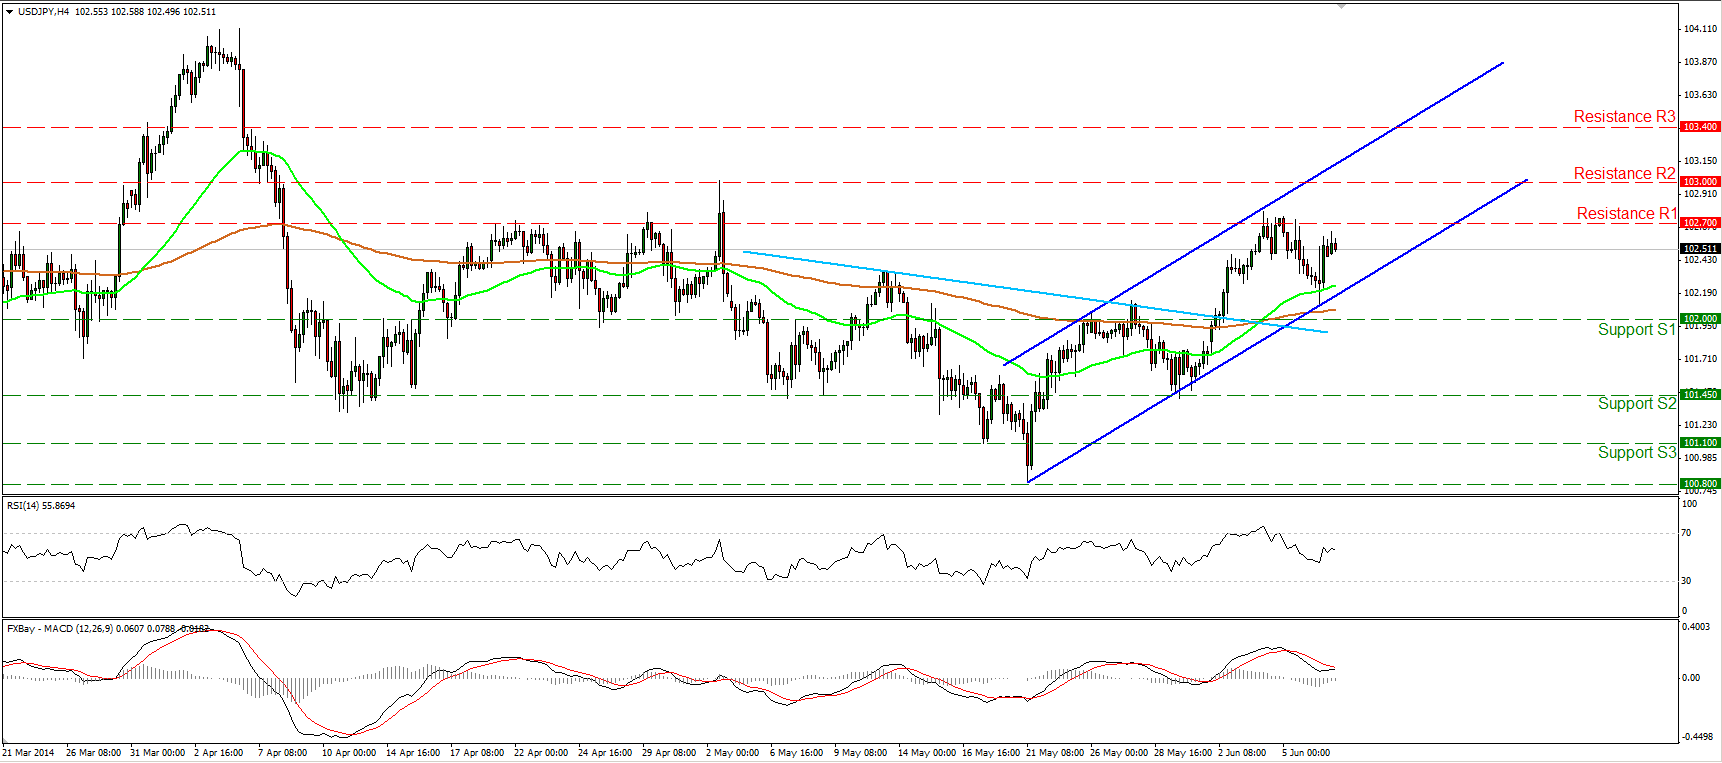
USD/JPY rebounded from the lower boundary of the upward sloping channel, slightly above the support zone of 102.00 (S1). The pair is now trading below the resistance zone of 102.70 (R1) where a decisive violation would confirm a higher high and have larger bullish implications. The MACD, already in its bullish territory, seems ready to cross above its trigger line. A cross in the near future would be an additional positive sign, favoring the continuation of the uptrend. As long as the rate is printing higher highs and higher lows within the channel, the short-term outlook remains to the upside.
Support: 102.00 (S1), 101.45 (S2), 101.10 (S3)
Resistance: 102.70 (R1), 103.00 (R2), 103.40 (R3)
EUR/GBP remains neutral
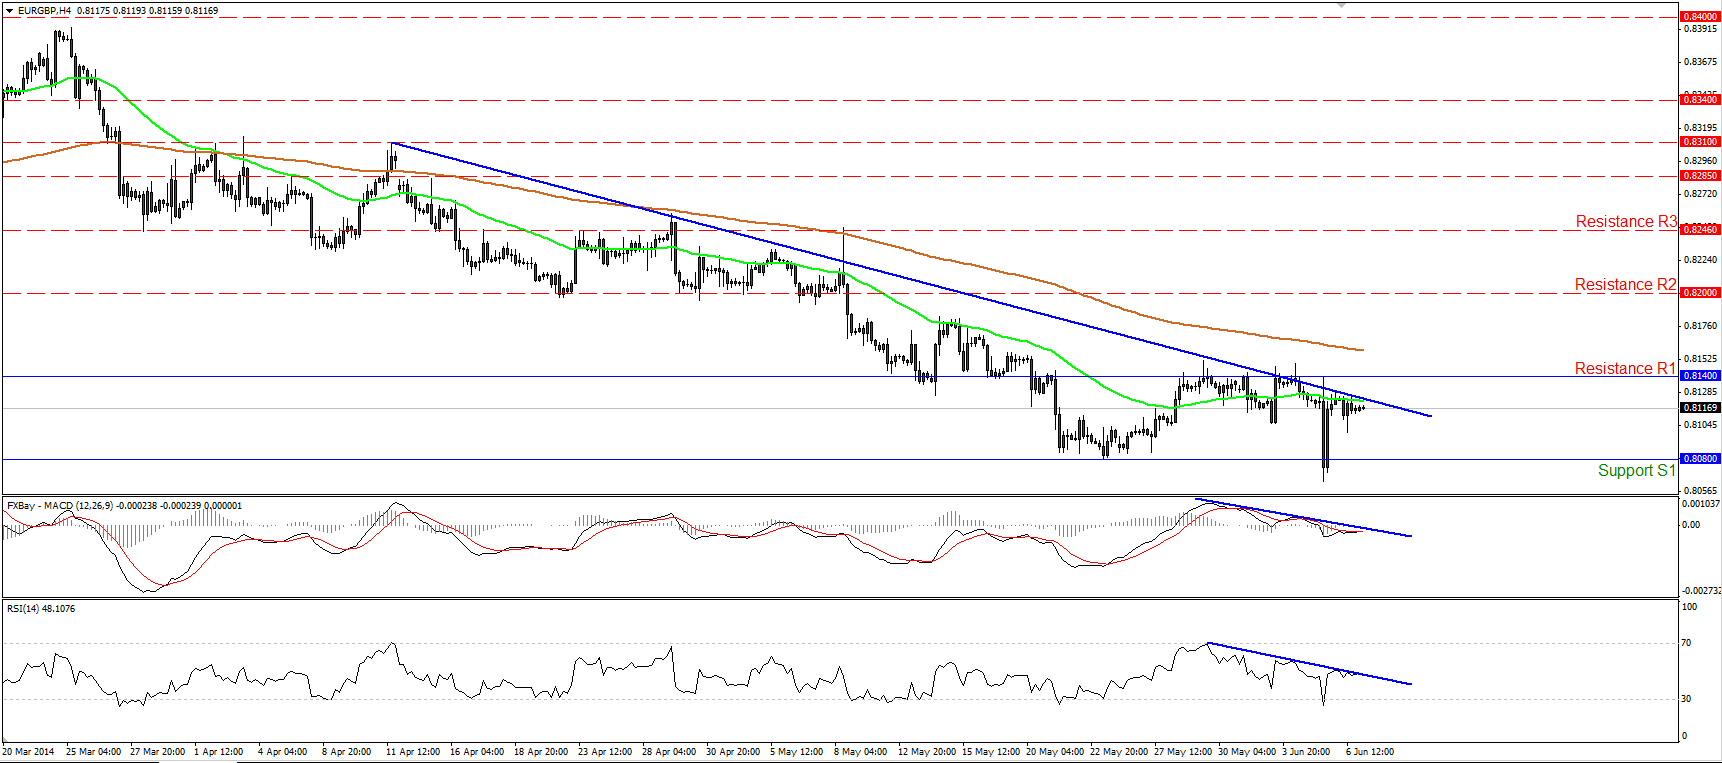
EUR/GBP moved in a consolidative mode, remaining below the blue downtrend line and below both the moving averages. The rate oscillates between the support of 0.8080 (S1) and the resistance of 0.8140 (R1) since the 20th of May, thus I would maintain my neutral view for now. Only a decisive dip below the 0.8080 (S1) barrier would confirm a forthcoming lower low and signal the reinforcement of the downtrend. On the other hand, a move above the 0.8140 (R1) zone could confirm a higher high and change the outlook to positive.
Support: 0.8080 (S1), 0.8035 (S2), 0.8000 (S3)
Resistance: 0.8140 (R1), 0.8200 (R2), 0.8246 (R3)
Gold still on a retracing mode
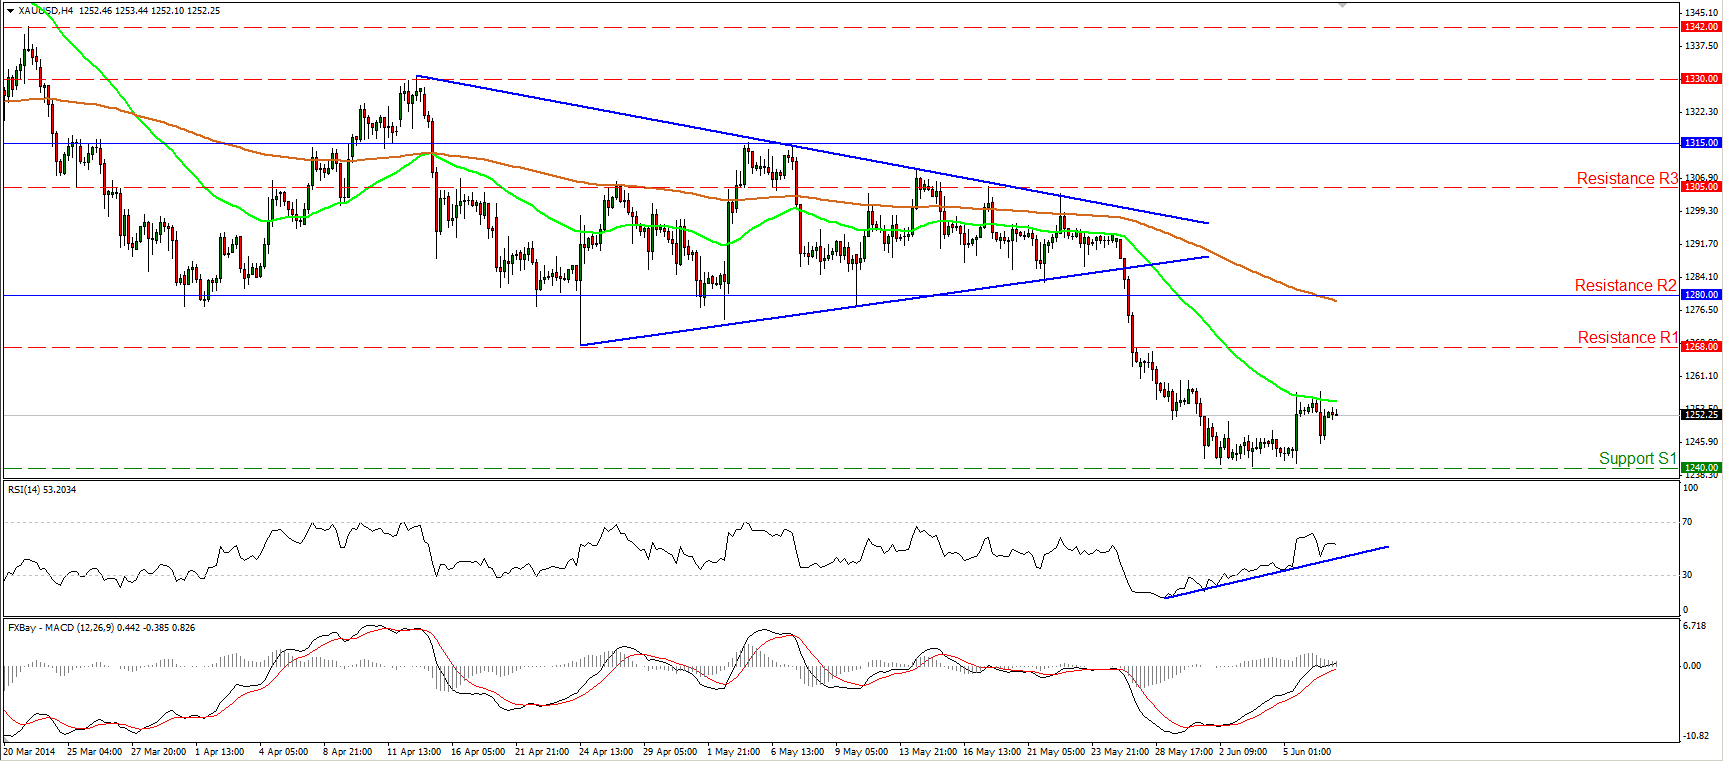
Gold moved in a consolidative mode on Friday, remaining below the 50-period moving average. Considering that the MACD, already above its signal line, managed to obtain a positive sign, I cannot rule out further advance, maybe for a test near the 1268 (R1) zone. Nonetheless, since the possibility for a lower high still exists, I would consider the upside wave as a retracement before the bears prevail again.
Support: 1240 (S1), 1218 (S2), 1200 (S3)
Resistance: 1268 (R1), 1280 (R2), 1305 (R3)
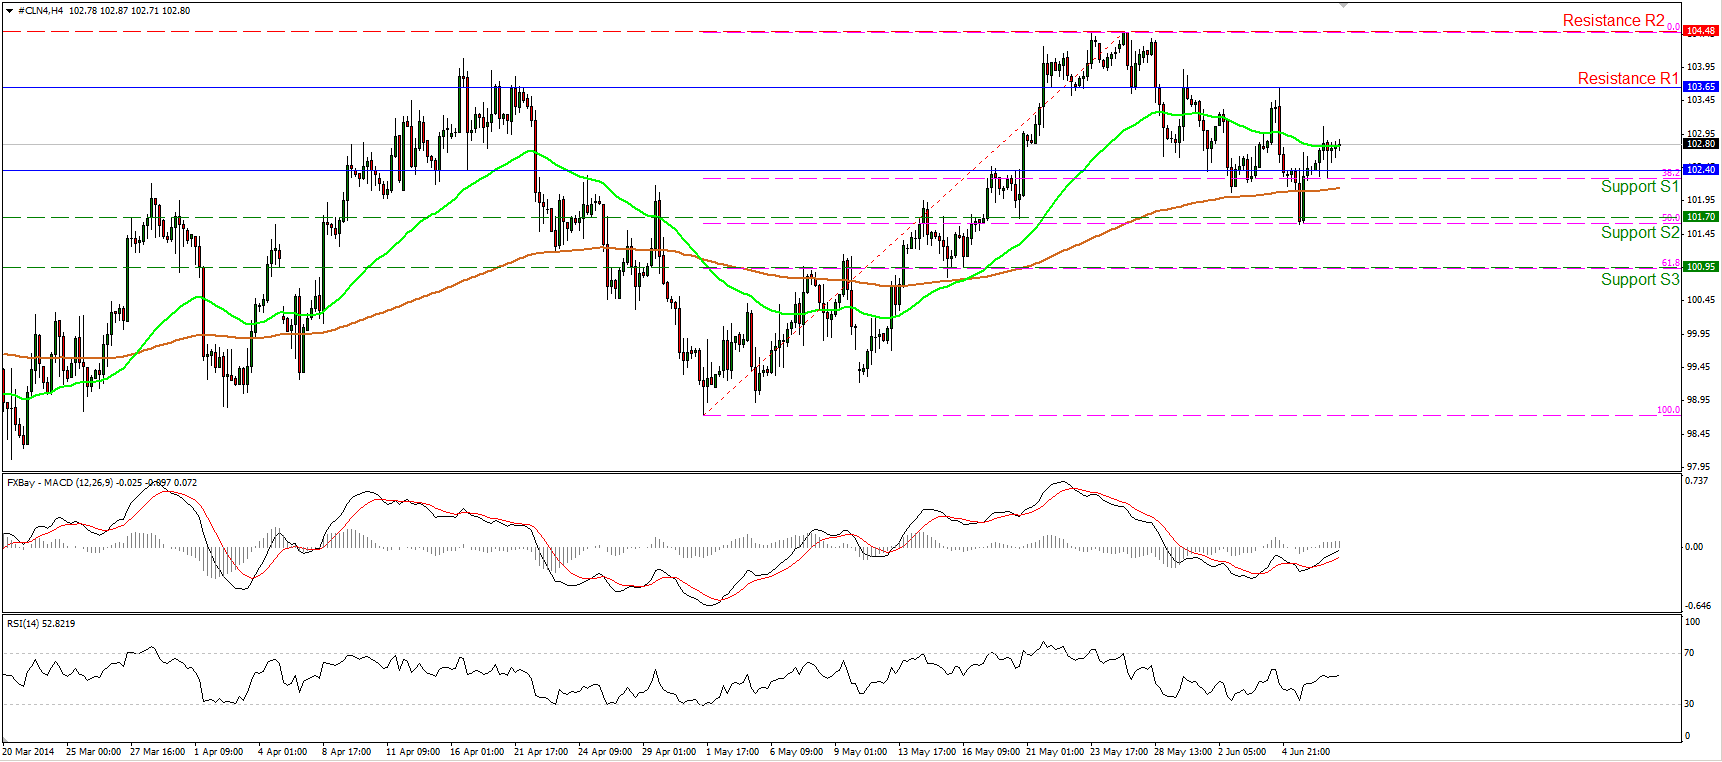
WTI confirms a hammer on the daily chart
WTI moved higher after breaking above the 102.40 zone. Considering that the MACD lies above its signal line and seems ready to enter its positive territory, I would expect the advance to continue, maybe for another test at the 103.65 (R1) hurdle. On the daily chart, Friday’s bullish candle, confirmed the hammer formed by Thursday’s candle, favoring further bullish extensions.