
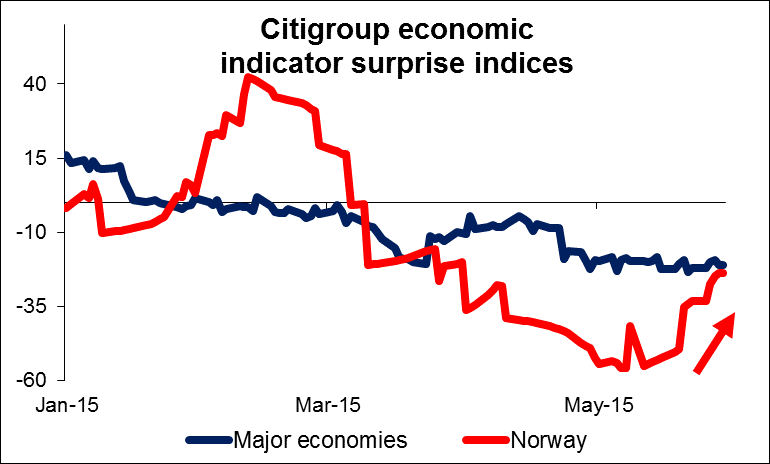
The Norwegian krone strengthened after the country’s unemployment rate declined and retail sales jumped, both beating expectations. The nation’s official unemployment rate declined to 2.7% in April from 2.9% previously, while retail sales rose 2.0% mom in April vs +0.5% mom the month before. As we have mentioned several times, Norway’s fundamentals are solid and the positive data could take off some pressure from the Norges Bank to cut rates at its June meeting. Therefore, NOK could strengthen somewhat going into the meeting.
Nevertheless, positive data surprises will be required to keep NOK supported. If the upcoming data are disappointing, especially the inflation data ahead of the meeting, NOK could come back under increased selling pressure.
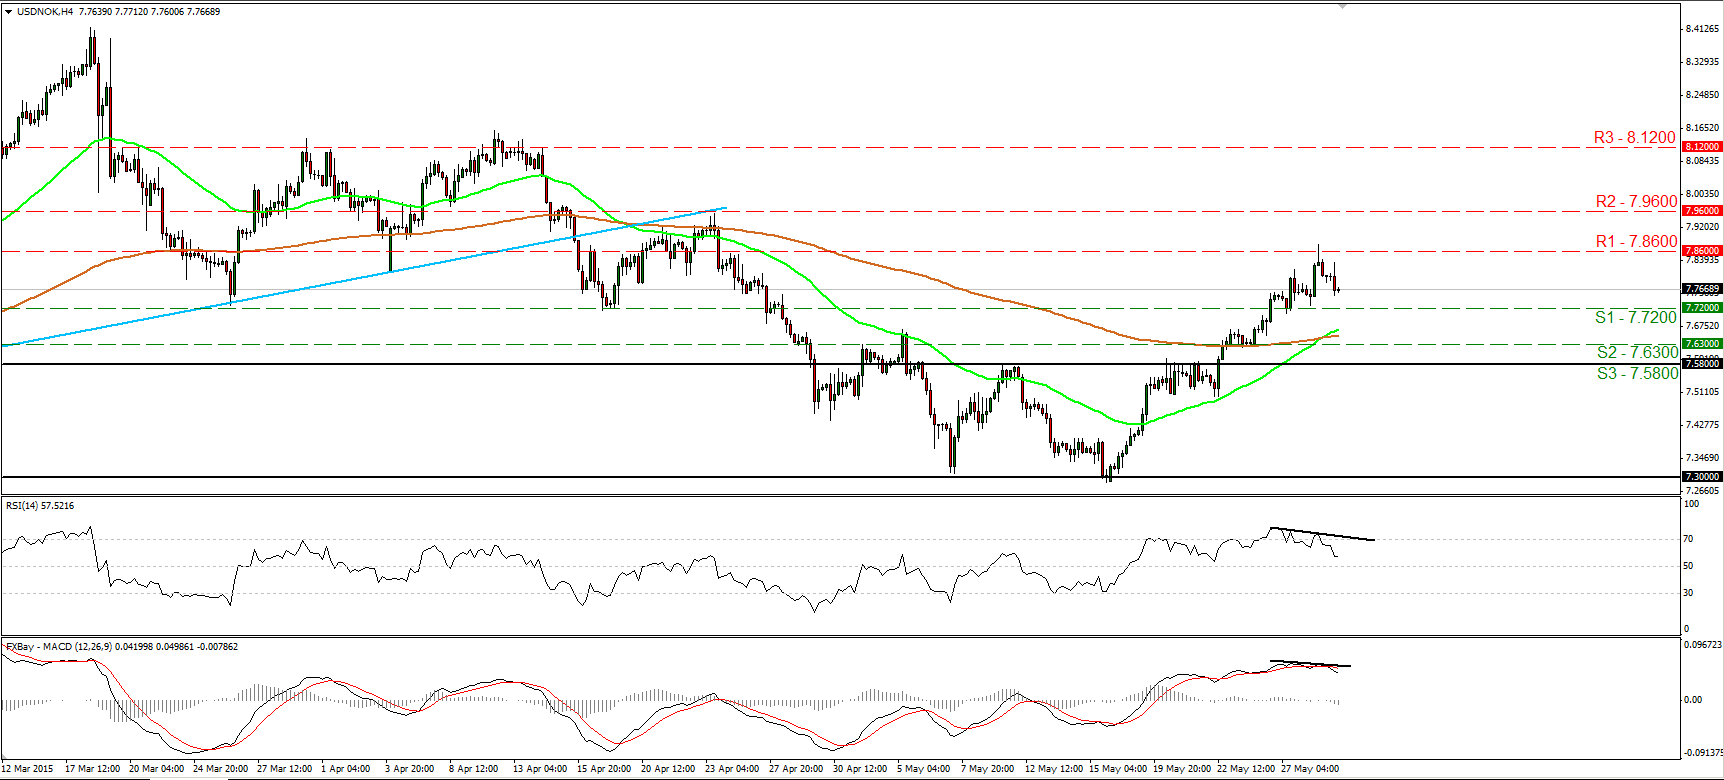
USD/NOK traded lower during the European morning Friday, after hitting resistance marginally above the 7.8600 (R1) line. Following the upside break of the 7.5800 (S3) hurdle on the 22nd of May, the short-term picture has turned positive in my view. However, our short-term oscillators give evidence that a deeper correction could be in the works before the bulls shoot again. The RSI exited its overbought territory, while the MACD has topped and fallen below its trigger line. What is more, there is negative divergence between both these indicators and the price action. A break below the 7.7200 (S1) barrier is likely to open the door for the correction case and perhaps trigger extensions towards 7.6300 (S2). On the upside, a break above 7.8600 (R1) is necessary to confirm a forthcoming higher high and signal the resumption of the near-term uptrend. In the bigger picture, on the 18th of May, the rate rebounded from the 7.3000 area and the 200-day moving average, which has been standing below the price action since June 2014. This alongside the break above 7.5800 (S3) indicate that the 18th of March – 18th of May decline was just a corrective phase and that the prevailing longer-term uptrend is probably gaining back its momentum.
• Support: 7.7200 (S1), 7.6300 (S2), 7.5800 (S3).
• Resistance: 7.8600 (R1), 7.9600 (R2), 8.1200 (R3).
Preparado por: Marshall Gittler, Charalambos Pissouros y Sakis Paraskevov