Ya sois muchos los que me piden un tutorial sobre la herramienta, pues voy a intentar dejar las ideas claras para que sirva de base a la hora de interpretar y entender el funcionamiento de la herramienta. Os dejo un gráfico del spread que se ha dado en la tarde-noche de hoy.
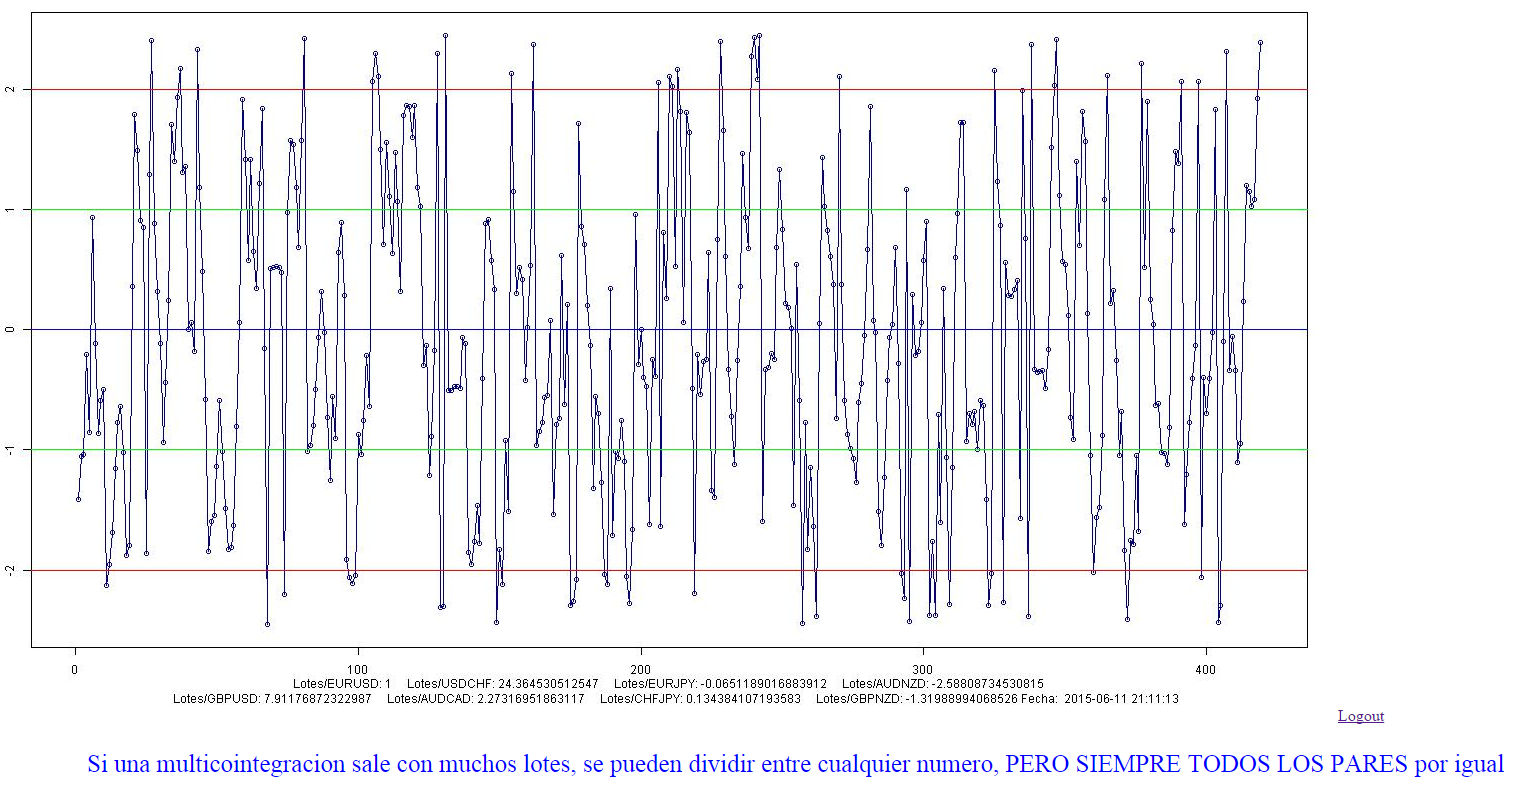
Se observa que el Spread está en la línea roja positiva, +2, esto se puede entender como la entrada óptima, ya que el vector de cointegración está en su máxima tensión y a partir de ese instante tiene que retornar a la media, para ello tenemos que vender todo el Portfolio, esto que quiere decir, que todos los lotes que están en la parte baja de la tabla se cambian de signo para hacer la multicointegración y quedaría de la siguiente manera con un redondeo a dos decimales.
EURUSD -1 USDCHF -24.36 EURJPY+0.06 AUDNZD +2.59
GBPUSD -7.91 AUDCAD -2.27 CHFJPY -0.13 GBPNZD +1.32
Esta sería la entrada óptima para nuestra multicointegración, pero tiene unos lotajes muy altos, por ello SIEMPRE aconsejo bajo mi forma de operar, que no entremos muy lotados porque hay que tener luego mucho capital para la apertura por margen de garantías y, seguidamente, por si se va un poco a la contra, se nos dispara el flotante, entonces ACONSEJO dividirla todos por un mismo número, por ejemplo entre 6 sería ideal y quedaría así:
EURUSD -0.17 USDCHF -4.06 EURJPY +0.01 AUDNZD +0.43
GBPUSD -1.32 AUDCAD -0.38 CHFJPY -0.02 GBPNZD +0.22
También os comento, si veis que sigue siendo alta por lotajes, se deja pasar sin problemas que otra vendrá que nos guste más.
Otra pregunta que también he contestado en varias ocasiones, cual sería el stop loss y el take profit, pues aquí cada uno tiene que hacer uso de su estrategia, personalmente no uso stop loss, pero esto es lo que a mí me va bien, si uno piensa que teniendo 300, 400, 600…, euros de stop loss está más tranquilo adelante. Sobre el take profit, basándonos claramente en el sistema de arbitraje, es la línea azul o media, pero NO SIEMPRE se cumple el cierre positivo en dicha línea, ya que se puede haber producido antes. En esto volvemos a lo mismo, para mí, 100-150 euros más que suficiente y a esperar si me interesa otra o apago hasta el día siguiente.
La herramienta se actualiza cada treinta minutos, se puede ver la última actualización abajo a la derecha donde sale la fecha y la hora de la misma, esto quiere decir que si no ha llegado a nuestro punto óptimo de entrada, hay que volver a mirar pasadas esas dos horas, que es lo que tarda nuestro sistema de inteligencia artificial (IA) en procesar mediante la red neuronal, los datos sobre la multicointegración, en sacar un nuevo gráfico del spread.
Espero haber resuelto muchas dudas con este pequeño tutorial, tenéis a disposición tanto el email como los comentarios en este post.
Saludos.
Versión Inglés
Many are already calling me a tutorial on the tool, then I will try to leave clear ideas to serve as a basis for interpreting and understanding the operation of the tool. I leave you a graph of the spread that has occurred in the evening today.
It is noted that the spread is positive red line, +2, this can be understood as the optimal entry, as the cointegrating vector is at its maximum voltage and from that moment must return average, for this we to sell the entire portfolio, that is to say, all lots that are on the bottom of the table to change sign and would multicointegration follows a rounding to two decimal places.
-1 -24.36 EURUSD USDCHF EURJPY +2.59 + 0.06 AUDNZD
GBPUSD AUDCAD -7.91 -2.27 -0.13 CHFJPY GBPNZD +1.32
This would be the optimum entrance for our multicointegration, but has very high lotajes why I always advise on how I operate, which did not enter very lotados because you have to then have a lot of capital for opening margin of guarantees and then by if you go a little to the contrary, we shoot the floating, then advised to divide all of the same number, for example between 6 would be ideal and would read:
EURUSD -0.17 -4.06 USDCHF EURJPY AUDNZD +0.01 +0.43
GBPUSD AUDCAD -1.32 -0.38 -0.02 CHFJPY GBPNZD +0.22
I will also comment, if you see that is still high by lotajes, it is allowed to pass without problems otherwise we will like better.
Another question I also answered several times, which would be the stop loss and take profit, because here everyone has to make use of their strategy, I personally do not use stop loss, but this is far as I’m doing well, if one thinks that taking 300, 400, 600 … euros stop loss is quieter on. On the take profit, clearly based on the arbitration system is the average blue line or, but not always positive closure is fulfilled in that line, as may have occurred before. In this return to the same thing, for me, 100-150 euros more than enough and if I want to wait another or turn off until the next day.
The tool is updated every thirty minutes, you can see the last update at the bottom right where it exits the date and time of it, this means that if you have not reached our optimal entry point, go back to look past those two hours, which is what takes our system of artificial intelligence (AI) to be processed by the neural network, the data on the multicointegration, shows a new graphic spread.
I hope I have solved many doubts with this little tutorial, you have available to both the email and the comments on this post.
Greetings.
3 respuestas a «Tutorial sobre la herramienta web multicointegración»
En el par EUR/JPY me salen 0.0035…. ¿Cómo puedo operar ese lotaje? Mi plataforma (MT4) me permite un mínimo de 0.01. Gracias de antemano.
Hola Carlos, muy buena esta pregunta ya que será útil para todos. Cuando esta por debajo del microlote (0,01), esto nos está mostrando que la multicointegración dicho valor, en este caso EUR/JPY no afecta para realizarla. Entonces se deja sin hacer y se aplican los otros 7 pares de divisas.
Un saludo.
Muchas gracias por la aclaración.